Scoring Tool
- สถานะ: Closed
- รางวัล: $10
- ผลงานที่ได้รับ: 4
- ผู้ชนะ: massm90s
รายละเอียดการประกวด
Hi all,
I am trying to automate a process currently done manually. Basically we monitor certain number of variables (13 in the example) and then we give each variable a weight (between 0 and 1) and then add the weighted score of each variable to get the final score. The 13 variables are grouped in 3 categories (Return, Risk, IR) and show a breakdown of the final score by this three categories. We need to get the score for each product for each month. The identifier of the product is called ISIN, and because the database was too big to upload I am uploading it splitted by calendar year.
Files Attached:
File: Tool_01242018_Example:
Tabs:
1.Universe: you can find all the months requested in this example (36 months), all the identifiers of the products requeted (566) and all the variables currently present in the DataBase (13 variables)
2.Summary: 4 examples of how the output should look like. I included two different months, two different products, the final score, and how it is breaken down by category. You can review the formulas so you can see how each datapoint is calculated.
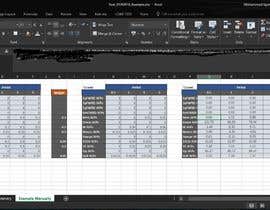
3. Example_Manually: How the final score and category score were calculated. In orange we have the weights that must be inputed by the user. In grey we have formulas (you can see how are they working), In green we have the corresponding value for the variablexDatexISINxPeriod retrieved from the DataBase.
DataBase_2015, DataBase_2016, DataBase2017: Where the data points are retrieved and pasted in the green boxes of the Example Manually.
We are not aiming to get a final output with this contest, we would like to get a tool which can achieve this task in an automated way. Basically the output should look likethe tab Summary and will have 566x36 rows and 6 columns and should be in Table format. The current process is very inneficient so we dont care if you would like to skip generating the tab Example_Manually, feel free to be creative, use any coding language that you would like and please reach out if you have any question.
Thank you!
Cristobal
Full Example:
Score ISIN LU0113993397 as of(12-31-2016):
1. Retrieve all the data points needed from DataBase_2016 and paste them on the green section Q4:T16 on the Example_Manually Tab of the Tool_01242018 excel file. For example, +'[Tool_01242018_Example.xlsx]Example_Manually'!$R$10 on the green section comes from +'[DataBase_2016.xlsx]2016'!$A$119863, which was obtained by filtering with the following criterias: END=31-12-2016; PERIOD=1 ;VARIABLE="IR AFPs";ISIN=" LU0113993397"
2. The user will give a weight for each variable, in this example they are on the orange section on this location: +'[Tool_01242018_Example.xlsx]Example_Manually'!$H$4:$H$16. The user must give a weight for each period of the variable which in this case will be on the other orange section located on '[Tool_01242018_Example.xlsx]Example_Manually'!$C$3:$F$16. For example, The weight of IR AFPs variable is 0.2 located on +'[Tool_01242018_Example.xlsx]Example_Manually'!$H$10. The weight within the variable IR AFPs for PERIOD=1 is 0.2 which is located on +'[Tool_01242018_Example.xlsx]Example_Manually'!$D$10. So the contribution to the final score of the variable IR AFPs (Period=1) is 0.2*0.2*-0,545741=-0,02182964
3. To get the contribution of each variable to the final score we just have to multiply the weight of each period for their respective value from the data base and the final sum multiply it for the weight of the variable in the model. For IR AFPs the contribution to the final score for the product analyzed as of 31-12-2016 is (0*-1,401801+0,2*-0,545741+0,5*0,708696+0,3*0,826888)*0,2= 0,09865324. Following the same procedure the contirbution to the final score of Sharpe AFPs is (0*0,607647+0*-0,150387+0*0,030786+0*0)*0= 0. The only two variables which belongs to the IR category are Sharpe Ratio and IR, so 0+0.09862324=0+0.09862324 is the contribution of IR category. (+'[Tool_01242018_Example.xlsx]Summary'!$F$2)
ทักษะแนะนำ
กระดานประกาศ
วิธีเริ่มต้นจัดการประกวด
-

จัดการประกวดของคุณ รวดเร็วและง่ายดาย
-

รอรับผลงานจำนวนมหาศาล จากทั่วโลก
-

มอบรางวัลให้แก่ผลงานที่ดีที่สุด ดาวน์โหลดไฟล์ - ง่ายดาย!


